Table of Contents
Understanding the Blue Screen of Death (BSOD)
What is a Blue Screen of Death?
The Blue Screen of Death (BSOD), a stop error or system crash, is an error screen displayed on Windows computers following a fatal system error. This error causes the system to stop completely, requiring a restart to temporarily resolve the issue.
What Causes a Blue Screen of Death?
- Hardware Failures: Issues with RAM, hard drives, or other hardware components.
- Driver Problems: Corrupt or outdated drivers can cause conflicts.
- Software Issues: Incompatible software, especially system-level software, can lead to crashes.
- Overheating: Excessive heat can cause hardware components to fail.
- Overclocking: Pushing hardware beyond its specifications can lead to instability.
How to Open and Debug a Blue Screen of Death
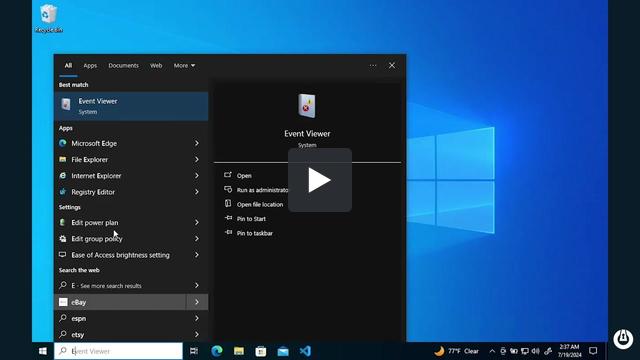
- How to view Blue Screen of Death (BSOD) information
- On-Screen Information: When a BSOD occurs, it displays an error code and a brief description. Note this information as it provides clues to the underlying issue.
- Minidump Files: Windows saves crash information in minidump files located in the `C:\Windows\Minidump` directory.
- To analyze the cause of a BSOD, follow these steps:
- Install Windows Debugging Tools:
- You can download the Windows Debugging Tools from the Windows SDK.
- Select only the Debugging Tools.
- Install Windows Debugging Tools:
- Set Up the Debugging Environment:
- Launch `WinDbg` (Windows Debugger).
- Configure the symbol path to help the debugger understand the Windows components involved. Use the following symbol path:
- Cmd line > SRV*c:\symbols*http://msdl.microsoft.com/download/symbols
- Open Minidump File:
- In `WinDbg`, go to `File > Open Crash Dump` and navigate to the minidump file (`.dmp`).
- Load the dump file. The debugger will start analyzing the file and load the necessary symbols.
- Analyze the Dump File:
- Use the `!analyze -v` command in the command window for detailed analysis.
- Look for the "BugCheck" code and the associated "MODULE_NAME" and "IMAGE_NAME" which point to the potential cause.
- Interpreting Results:
- BugCheck Code: Provides an error code indicating the type of error.
- Causing Module: Identifies the driver or component that likely caused the crash.
Simulating a Blue Screen of Death:
Simulating a Blue Screen of Death (BSOD) can be helpful for testing purposes. Here’s a step-by-step guide to simulate a BSOD on a Windows machine, followed by how to capture screenshots during the process.
Method 1: Using the "NotMyFault" Tool
- Download notmyfault.exe:
- Download "NotMyFault" from the [Microsoft Sysinternals website] (https://docs.microsoft.com/en-us/sysinternals/downloads/notmyfault).
- Unzip and execute the tool:
- Unzip the downloaded zip file and run `NotMyFault.exe`.
- Trigger a BSOD:
- In the notmyfault.exe, select the “Crash” tab.
- Click on “Do Bug” to trigger a BSOD.
Method 2: Forcing a Blue Screen of Death via Registry and Keyboard Shortcut:
This method involves modifying the Windows registry and using a keyboard shortcut to trigger a BSOD.1. Modify Registry:
- Open `regedit` and navigate to: HKEY_LOCAL_MACHINE\SYSTEM\CurrentControlSet\Services\kbdhid\Parameters
- Create a new `DWORD` value named `CrashOnCtrlScroll` and set its value to `1`.
- Restart the Computer:
- Restart your computer for the changes to take effect.
- Trigger the BSOD:
- After rebooting, you can force a BSOD by holding the `Ctrl` key on the right side of the keyboard and pressing the `Scroll Lock` key twice.
Debugging the Blue Screen of Death:
Once you have simulated a Blue Screen of Death (BSOD), you can analyze the crash dump using WinDbg.
- Open WinDbg:
- Launch `WinDbg` and set the symbol path: **Cmd > SRV*c:\symbols*http://msdl.microsoft.com/download/symbols
- Load the Minidump File:
- Go to `File > Open Crash Dump` and select the minidump file from `C:\Windows\Minidump`.
- Analyze the Dump:
- Use the `!analyze -v` command to get detailed information about the crash.
References:
[Microsoft Sysinternals - NotMyFault](https://docs.microsoft.com/en-us/sysinternals/downloads/notmyfault)
[Microsoft Docs - WinDbg Preview Installation](https://docs.microsoft.com/en-us/windows-hardware/drivers/debugger/debugger-download-tools)
[How to Trigger a BSOD](https://www.thewindowsclub.com/how-to-force-a-blue-screen-in-windows-10)
[Microsoft Docs: WinDbg Preview - Installation](https://docs.microsoft.com/en-us/windows-hardware/drivers/debugger/debugger-download-tools)
[How to Fix Blue Screen of Death (BSOD)](https://www.lifewire.com/how-to-fix-a-blue-screen-of-death-2624518)
[YouTube: How to Use WinDbg to Analyze a BSOD](https://www.youtube.com/watch?v=5S6JCMvN6gY)


